Federal Layoff Burden
The goal of this project was to identify the US counties that are the most economically dependent on federal employment and to explore the geographic distribution of these locations. To do so, I calculated the ‘layoff burden’ for each state and created an exposure index highlighting areas particularly susceptible to consequences related to the downsizing of federal agencies.

Layoff burden values combine the proportion of federal employment with the Center for Disease Control’s Social Vulnerability percentile ranking, both ranging from 0-1. Federal employment is given a higher weight. Given time constraints, I decided not to reapportion state-level employment data to counties, and to simply use bivariate symbology to visualize results at both levels. However, factors like land use, federal facility locations, and commuter data could be used to more realistically assign state-level values to counties.
This figure shows the potential exacerbation of socioeconomic issues by federal layoffs. The area around the Great Lakes has a generally low layoff burden score, speaking to the generally high socioeconomic status and relatively low proportions of federal employment.
Developed as a final project for a socioeconomic GIS course, this work was primarily focused on applying learned concepts to socioeconomic data. While inspired by real-world events, the project relied on approximated values and simplified processes; it serves more as a proof of concept than definitive analysis.
Input Variables

Employment Data
I used a CNN report outlining estimates of the percentages and approximate numbers of employees from 30 listed federal agencies laid off as of March 28, 2025. As of April 26th, 2025, the report estimated that a total of over 100,000 federal employees had been laid off. To get these values, CNN compiled information from the agencies themselves, the United States Office of Personnel Management (OPM), and other news sources such as AP, NPR, Politico, the New York Times, ABC, and Reuters. These numbers do not include employees that have since been reinstated, nor those placed on leave.
To estimate the accuracy of the CNN data, I multiplied the employee numbers from the OPM by the percentage of employees fired according to CNN. The approximate number of employees fired from the CNN article and the results I got from multiplying those percentages by the federal workforce data had a 98.9% correlation
The number of employees for each agency before the layoffs began (from June to September, 2024) is from the United States OPM using FedScope, the interface for accessing federal workforce data. I used R to combine the 30 federal employment data frames with the CNN estimates and determine the number of employees for each agency in each state, the percentage laid off, and the approximate number of employees laid off. Employment data from the American Community Survey 5 year estimates provided the total number of people employed.

To estimate the preexisting susceptibility to economic impacts imposed by federal layoffs, pre-processed Social Vulnerability Index from the Center for Disease Control (CDC), using Harvard’s “dataverse.”

The CDC’s Social Vulnerability Index (SOVI) examines 16 factors for each county to calculate values for four ‘themes,’ or smaller indices, including socioeconomic status, household characteristics, racial and ethnic Minority Status, and housing type and transportation. These values are combined to establish an overall vulnerability rating. For simplicity, I used only the socioeconomic status theme which incorporates the population for each county that is below 150% poverty, unemployed, with a high housing cost burden, no high school diploma, and no health insurance.
Spatial Analysis
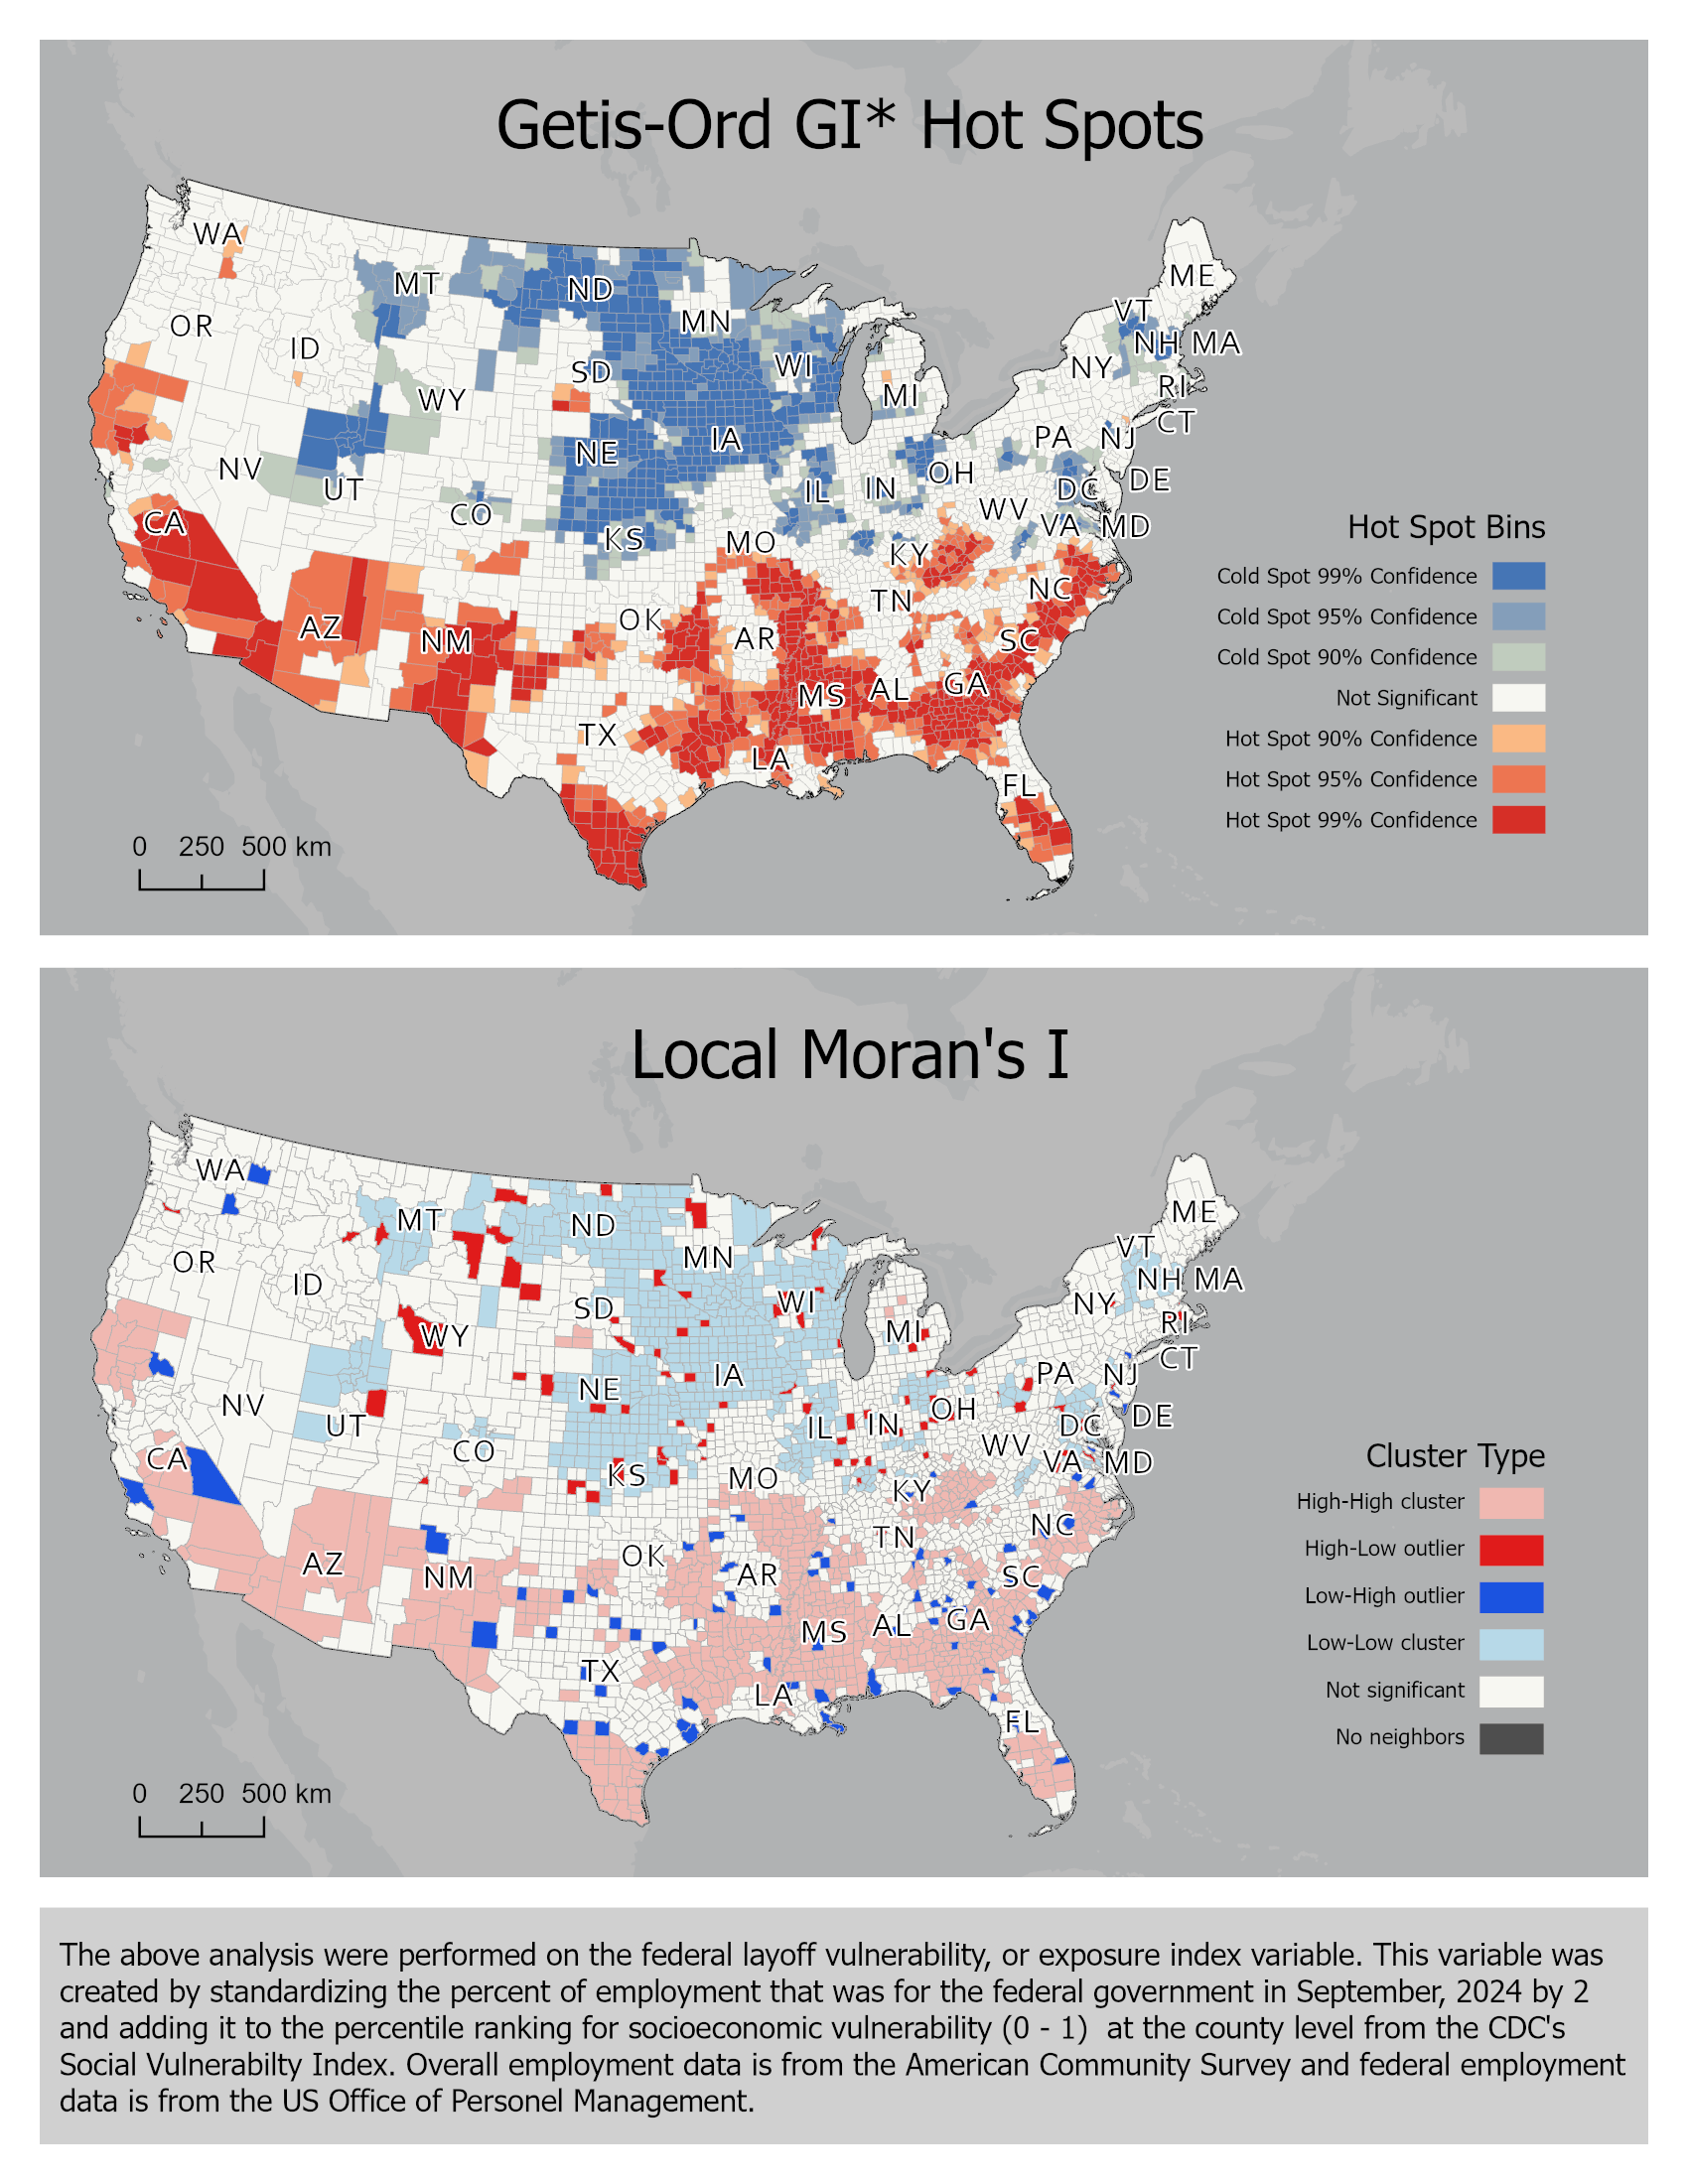
A Getis-Ord GI* hotspot analysis of federal layoff vulnerability helps to isolate spatial clusters in the results. The output shows a distinct pattern of hotspots forming a belt in the South, and a cold spot again in the Midwest. For many Southern states, one could assume that this hotspot relates to an overall trend of high socioeconomic vulnerability in the region, but for Georgia, Alabama, and New Mexico a significant number of federal jobs likely contribute highly as well.
A Local Moran’s I analysis of federal layoff vulnerability points to spatial outliers, counties that are outliers in their respective neighborhoods, and clusters of significant spatial autocorrelation. For instance, Broadwater, Montana stands out amongst its neighbors as a more vulnerable county, potentially relating to the low population, seasonal economy, and reliance on the mining industry.